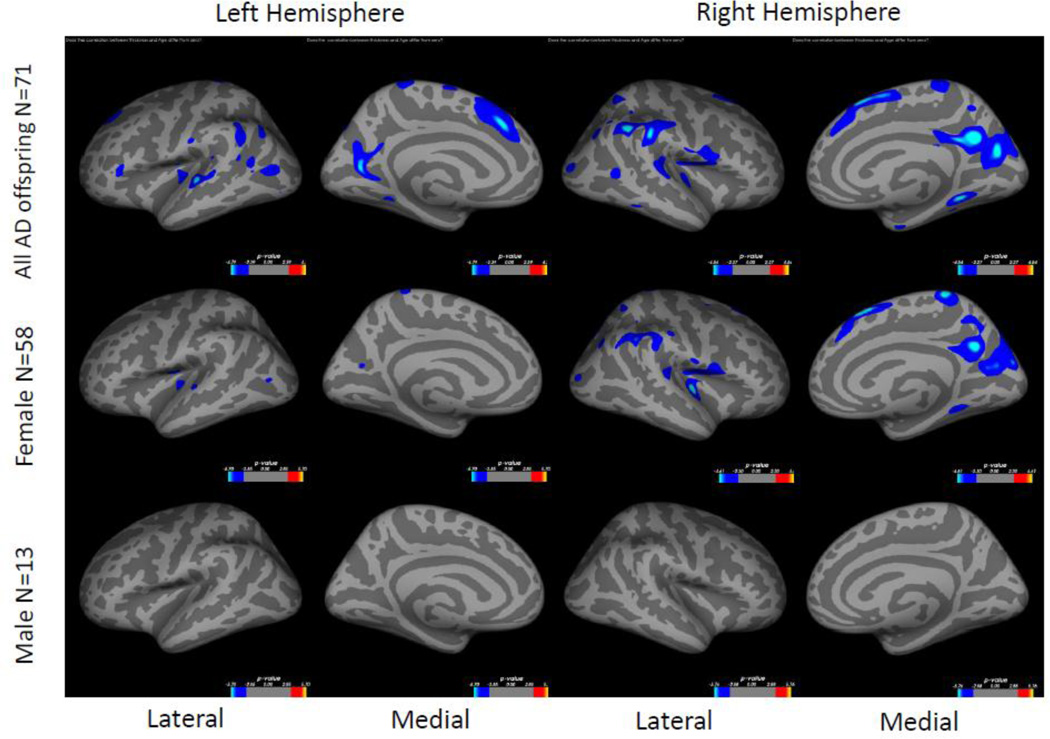
Figure 4. Correlation between cortical thickness and age in female and male AD offspring.
Colored regions represent areas of statistical significance shown as −log10(p) with FDR correction of 0.05. Blue regions indicate a negative correlation and red regions indicate a positive correlation. Top row shows all AD offspring (same as Figure 1, top row), middle row shows female AD offspring, and bottom row shows male AD offspring. Left two columns are the left hemisphere and the right two columns are the right hemisphere. Columns 1 and 3 show the lateral side and columns 2 and 4 show the medial side.

