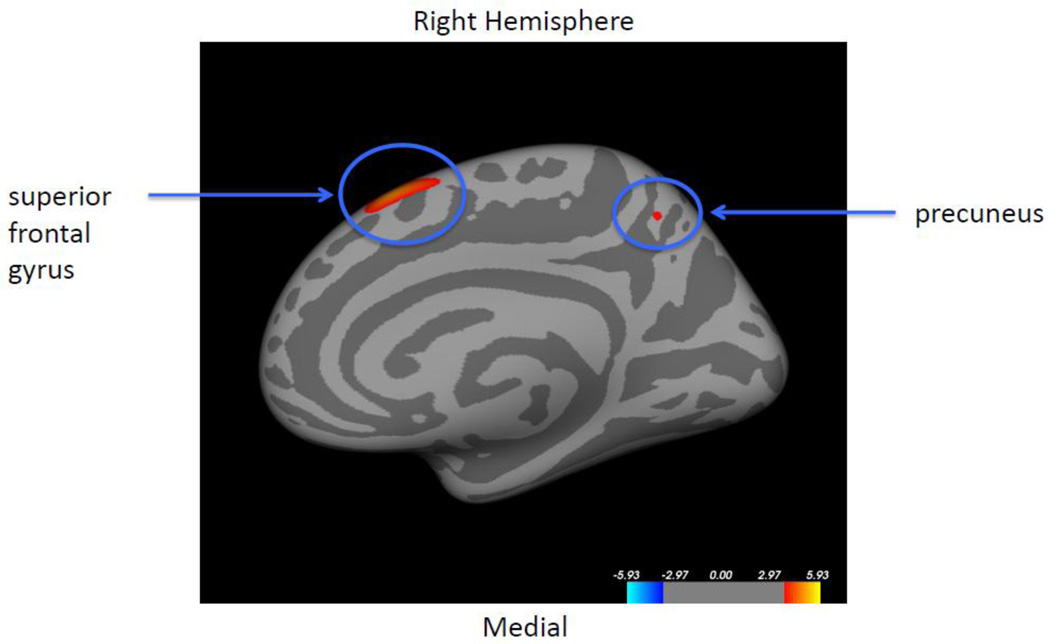
Figure 6. Correlation between cortical thickness and age, controlling for ApoE4 status.
Colored regions represent areas showing statistically significant differences in thickness-age correlation, between AD offspring and non-AD offspring, controlling for ApoE4 status. Statistical significance is shown as −log10(p) with FDR correction of 0.05. After controlling for ApoE4 status, the AD offspring showed more age-related cortical thinning than the non-AD offspring in the superior frontal gyrus and the precuneus of the right hemisphere (red regions). There were no other areas of significant thickness-age interaction in either hemisphere.

