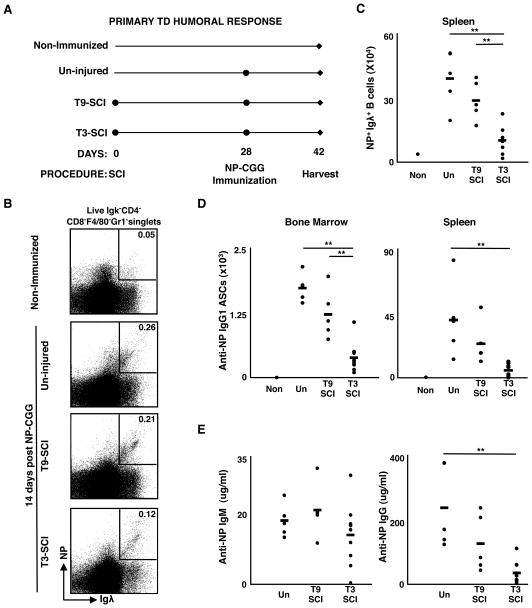
Figure 4. The magnitude of TD responses is reduced during chronic SCI.
(A) Experimental design for NP-CGG immunization: 28 days post-SCI, mice were immunized with NP-CGG, and at day 14 post-immunization, spleen and bone marrow from 2 hind limbs were analyzed. (B) Representative FACS gating strategy to identify NP-specific B cells. Dot plots show the frequency of Aqua−CD4−CD8−F4/80−Gr1−Igκ−Igλ+NP+ responding B cells among live singlets. (C) The total number of splenic NP-specific cells. (D) Total number of NP-specific IgG1 ASCs present in BM and spleen. (E) Serum levels of NP-specific IgM and IgG1 antibody above non-immunized controls. For all data sets, n=5 for un-injured, n=5 for T9-SCI, and n=9 for T3-SCI. Data are representative of two experiments. ** denotes significance at p<0.01 and * denotes significance at 0.01≤p<0.05.

