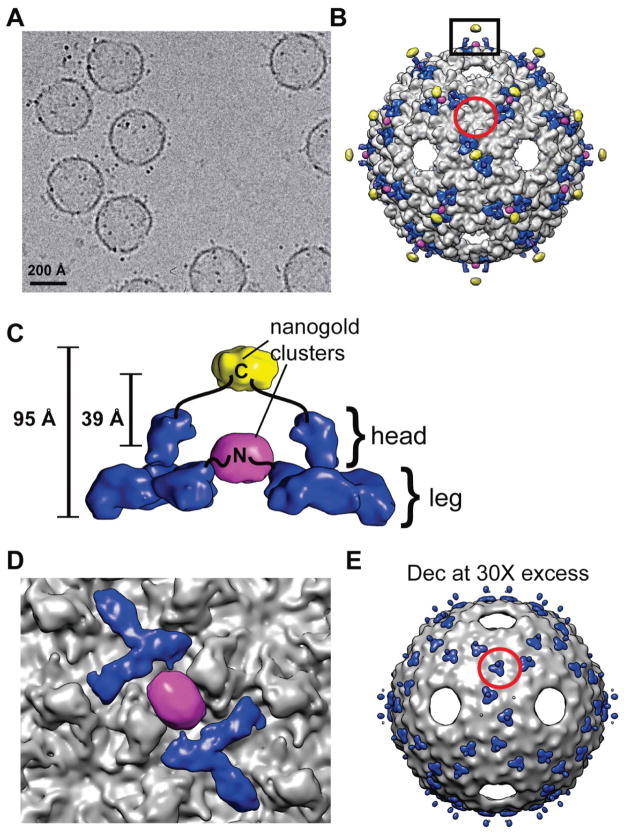
Figure 2. Dec binding to ExH.
A) Micrograph of vitrified sample of ExH-DecC-his to which Ni-NTA nanogold (“Au”) was bound. B) Shaded-surface representation, viewed along a two-fold axis, of a hybrid density map constructed from portions of four separate cryo-reconstructions (ExH, ExH-Dec, ExH-DecN-his-Au, and ExH-DecC-his-Au). ExH appears in greyscale, Dec is rendered blue, and the nanogold clusters are colored yellow (C-his tag) and magenta (N-his tag). The Dec density was obtained from the ExH-Dec minus ExH difference map, and the nanogold densities were obtained from the corresponding ExH-Dec-Au minus ExH-Dec difference maps. The red circle outlines the region near one icosahedral three-fold axis. C) Enlarged view of the region boxed in panel (B), showing the nanogold clusters bound to a pair of neighboring Dec trimers. Black lines schematically represent the linkers that connect the clusters to the N- and C-termini in the leg and head portions of Dec [15], respectively. D) Close-up view of (B), with density beyond a radius of ~320 Å masked out to emphasize and highlight interactions between the Dec leg domain (blue) and the N-terminal, his-tagged nanogold cluster (magenta). E) Similar to (B) for the cryo-reconstruction of the ExH-DecC-his sample incubated with 30-fold excess Dec. This shows Dec trimers bound at strict three-fold sites on the ExH particle (one such trimer is highlighted by the red circle for comparison with panel (B)).

