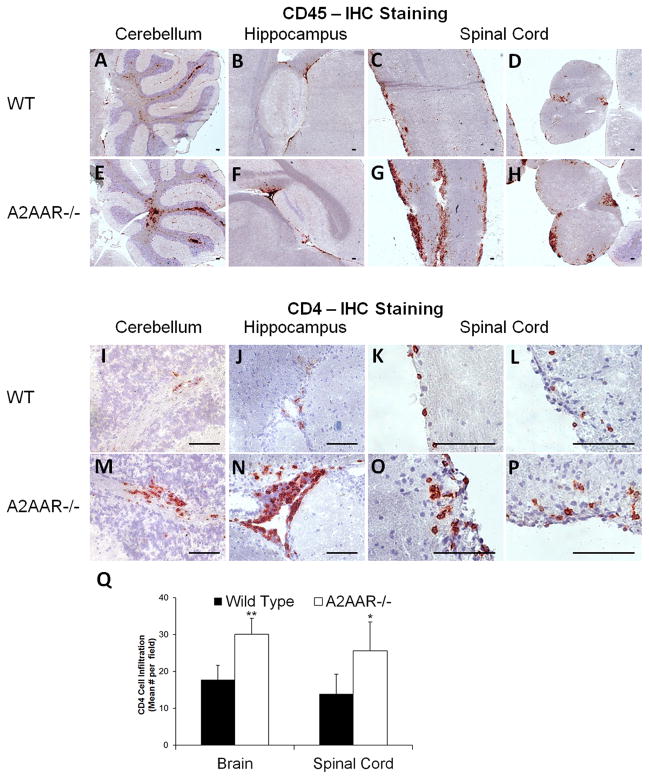
Figure 2. Increased numbers of lymphocytes are observed in the brain and spinal cord of A2AAR−/− mice following EAE.
Representative pictures taken from frozen tissue sections of the cerebellum (A, E, I, M), hippocampus (B, F, J, N) and spinal cord (C–D, G–H, K–L, O–P) from post-EAE induced wild type (A–D, I–L) and A2AAR−/− (E–H, M–P) mice were labeled with either CD45 (A–H) or CD4 (I–P) antibodies to detect lymphocyte infiltration in the CNS follow disease induction. Immunoreactivity was detected with HRP anti-rat Ig plus AEC (red) against a hematoxylin stained nuclear background (blue). Scale bars represent 100 μm. (Q) In post-EAE induced wild type and A2AAR−/− mice, six anatomically similar fields per brain [cerebellum (2x), hippocampus (2x), frontal lobe, and brain stem] and 4 fields per spinal cord per mouse were analyzed at 10x magnification for CD4 cell infiltration. Error bars represent the standard error of the mean (n ≤ 10). Statistically different infiltrating CD4 cells mean values counted per field between wild type and A2AAR−/− mice in each tissue are displayed (*, p ≤ 0.05; **, p ≤ 0.01).

