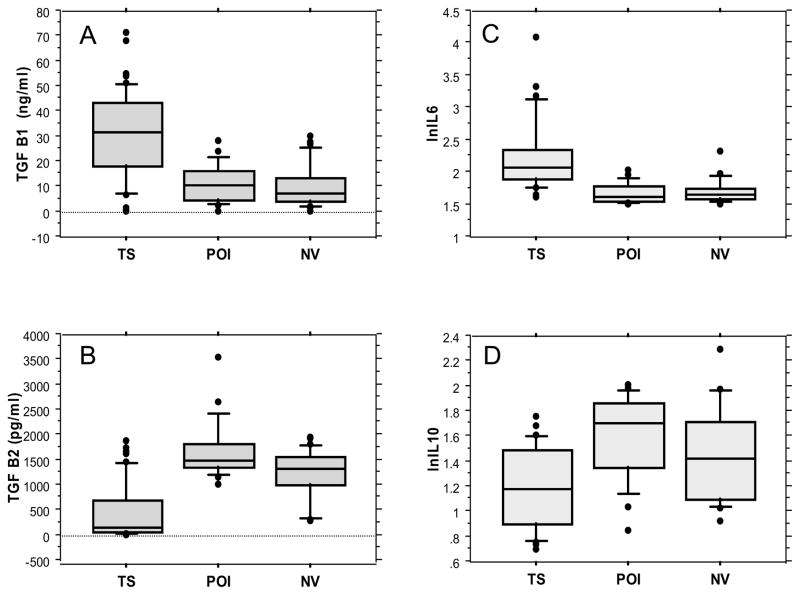
Fig. 2. Serum cytokines in women with TS, POI and women with normal ovarian function.
The box plot graphs show interquartile range and median within the box and 10–90 centile range within the whiskers. There were 20 women in the POI and NV assays, and 49 in the TS group. Each group included individuals between ages 20–40 yrs and BMI 18–30 kg/m2. This data is further compared in Table 3. TS - Turner syndrome; POI - primary ovarian insufficiency; NV- women with normal ovarian function

