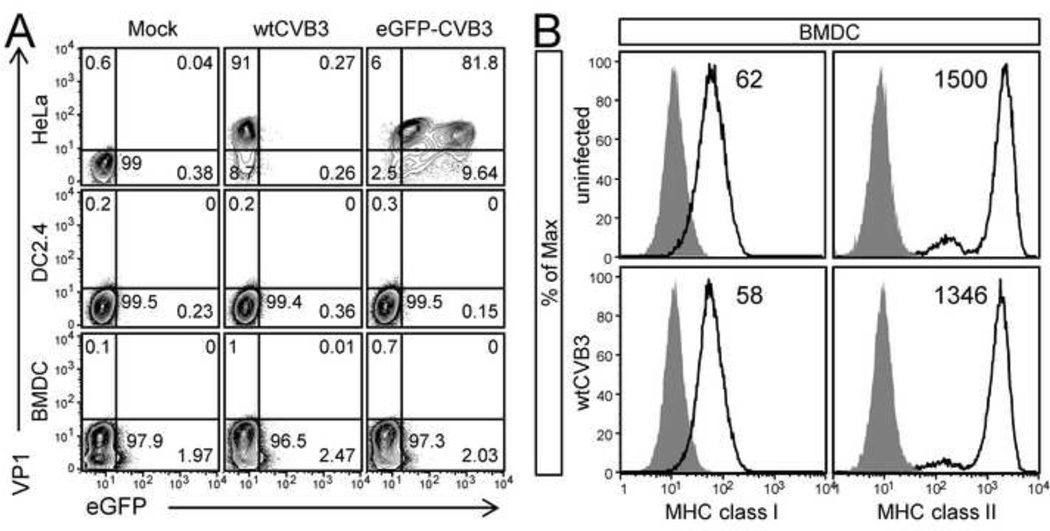
Figure 6. wtCVB3 has little effect on dendritic cells in vitro.
(A) Bone marrow monocyte-derived dendritic cells (BMDCs) and the DC2.4 dendritic cell line were evaluated for their susceptibility to CVB3 infection; HeLa cells were infected as a positive control. HeLa, DC2.4, and BMDCs were incubated with wtCVB3 or eGFP-CVB3 (MOI=10) for 1 hr, or mock infected. Inoculum was removed, and cells were harvested (HeLa cells, 6 hrs p.i.; BMDC & DC2.4, 24 hrs p.i.), stained for intracellular VP1, and the percentage of cells expressing VP1 ± eGFP was determined by flow cytometry. Representative contour plots are shown for each cell type, and the numbers indicate the proportion of cells in each quadrant, as a percentage of all cells in the plot (VP1+, upper left quadrant; eGFP+, lower right quadrant; VP1+eGFP+, upper right quadrant). (B) BMDCs (cultured with GM-CSF) were infected with wtCVB3 (MOI=100), or left uninfected, and the surface expression of MHC class I and II were analyzed by flow cytometry 18 hrs p.i. Histograms are gated on CD11c+CD11b+ cells, and show the expression of MHC class I or II (black lines); isotype control staining is shaded grey. The number on each histogram indicates the geometric mean fluorescence intensity of MHC class I or II. Data are representative of 2 independent experiments.

