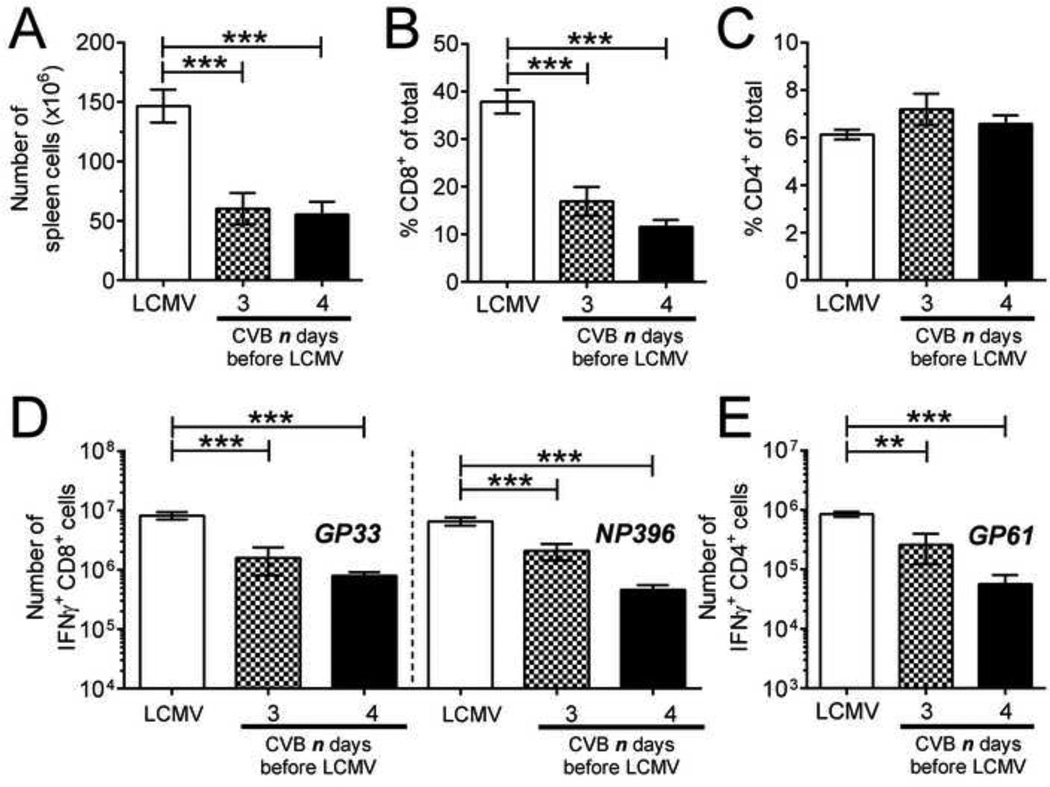
Figure 7. CVB3-infected mice mount weaker CD4+ and CD8+ T cell responses to a secondary virus infection.
Groups of mice were infected with wtCVB3, and then co-infected with LCMV (3 or 4 days after the primary infection with CVB3). An additional group of mice was infected only with LCMV. LCMV-specific CD8+ and CD4+ T cell responses were analyzed 7 days after LCMV infection by flow cytometry. (A) Total number of mononuclear cells in the spleen. (B & C) Frequency of CD8+ and CD4+ T cells in the spleen, as a percentage of total mononuclear cells. (D & E) Splenocytes were stimulated with peptide, and the total numbers of T cells producing IFNγ in response to GP33 & NP396 peptides (D), and GP61 peptide (E) were determined by flow cytometry. Data show the mean ± SEM of 6 or 8 mice per group, combined from 2 independent experiments (** p<0.01, *** p<0.001).

