Figure 3.
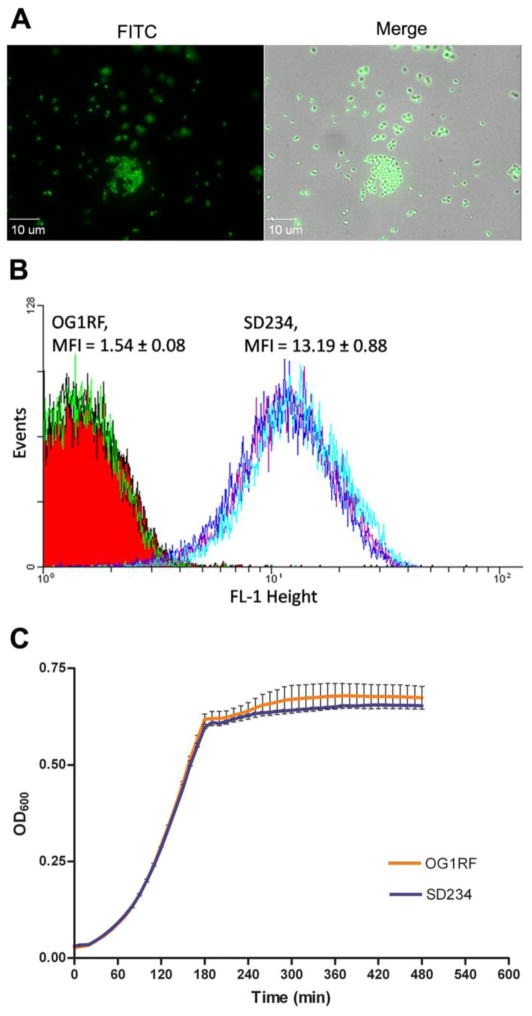
Expression of gfp in E. faecalis. A) Fluorescent micrographs of SD234 expressing gfp. B) FACS analysis of exponential cultures of OG1RF wild type and SD234 strains. SD234 forms a tight peak representing a single population of fluorescent cells suggesting ubiquitous expression of gfp. C) In vitro growth of OG1RF and SD234 in BHI medium at 37°C. Each data point represents triplicate samples and error bars indicate standard error.

