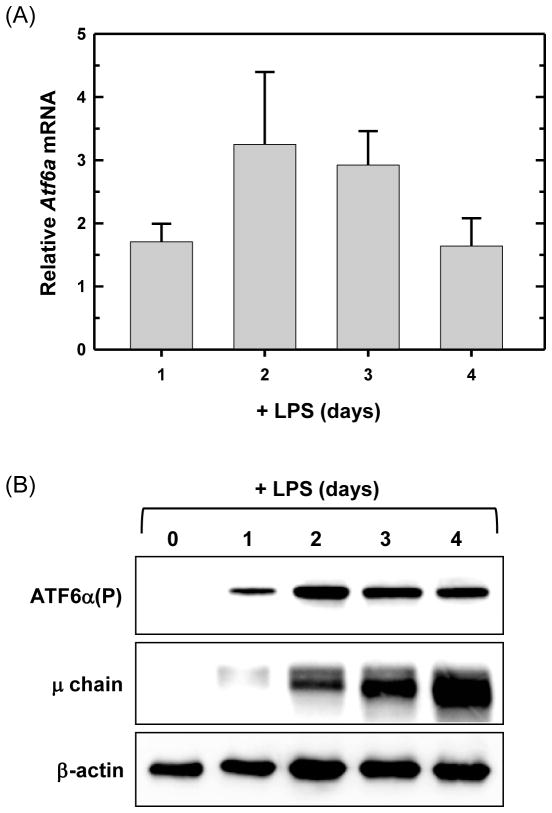
Fig. 1.
Expression of ATF6α in resting and LPS-stimulated splenic B cells. Splenic B cells were isolated from wild-type mice and cultured in the presence of LPS for the indicated intervals. (A) Atf6a expression was assessed by quantitative real-time RT-PCR (qRT-PCR). Data are plotted as the level of Atf6a mRNA in LPS-stimulated cells relative to that in freshly isolated, resting cells (set at 1) (mean ± S.D., n = 3). (B) Immunoblot analysis of ATF6α(P) (full-length, precursor form), Ig μ heavy chain as a positive control for differentiation and β-actin as a control for loading and sample integrity. Data are from a representative experiment out of three repeats.

