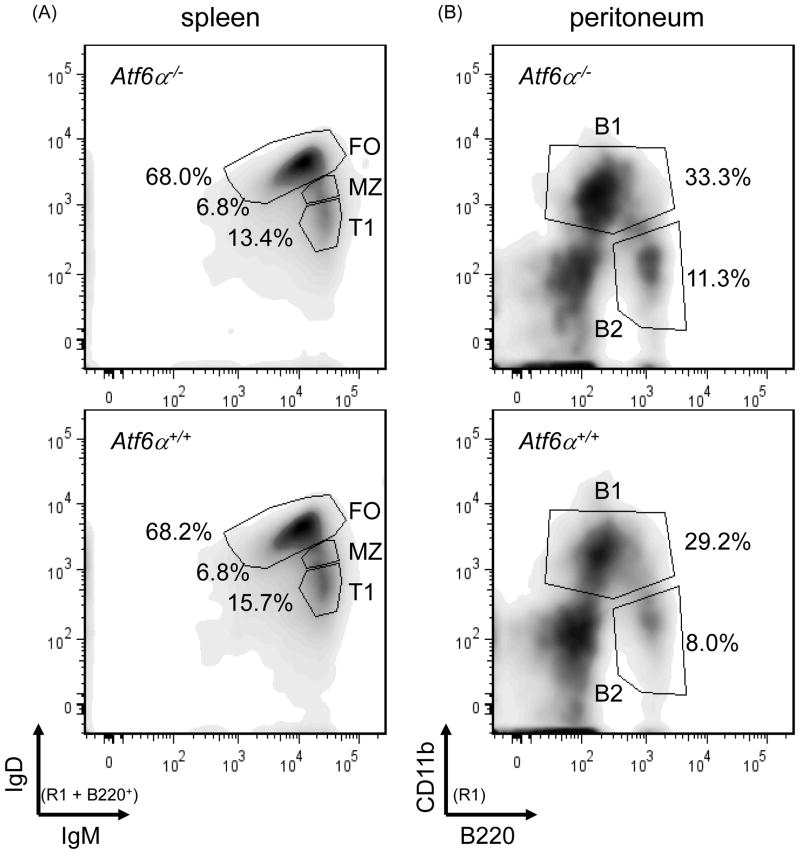
Fig. 2.
Flow cytometry analysis of lymphocyte populations in wild-type and ATF6α-deficient mice. Splenocytes and peritoneal cells were isolated from age- and gender-matched Atf6a+/+ and Atf6a−/− mice, stained with fluorochrome-labeled antibodies specific for cell surface markers that discriminate lymphocyte populations and analyzed by flow cytometry (R1 = lymphocyte gate as determined by visible light scatter). (A) B220+ splenocytes were assessed for levels of IgM and IgD to identify follicular (FO), marginal zone (MZ) and transitional T1 subpopulations. These subsets were further analyzed for levels of CD21, CD23, and CD93 to validate their identity and/or to identify additional subsets (Table 1 and data not shown). (B) Peritoneal cells were stained with B220 and CD11b to reveal B1 and B2 B cells. Five mice for each genotype were analyzed and representative density plots are shown.

