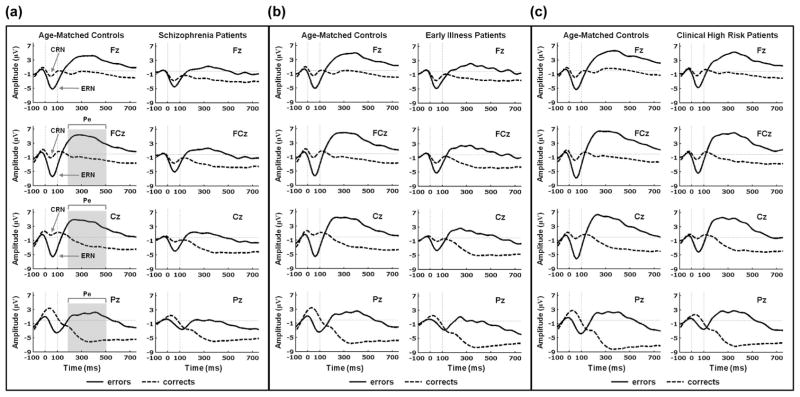
Figure 2.
Grand average ERP waveforms for response-locked error (solid) and correct (dashed) trials for age-matched healthy control participants and schizophrenia, early illness schizophrenia, and clinical high risk patients. Data shown in waveforms are from Fz, FCz, Cz, and Pz channels. The x-axis presents time in milliseconds from -100 ms (pre-response) to 750 ms (post-response) relative to the button press (0 ms). The y-axis presents amplitude in microvolts (μV). ERN and CRN peaks are signified by arrows at Fz, FCz and Cz, and the Pe time window (200 to 500 ms) is depicted by the gray bar at FCz, Cz and Pz in (a). (a) age-matched healthy control participants (left) and schizophrenia patients (right); (b) age-matched healthy control participants (left) and early illness schizophrenia patients (right); (c) age-matched healthy control participants (left) and clinical high risk patients (right).

