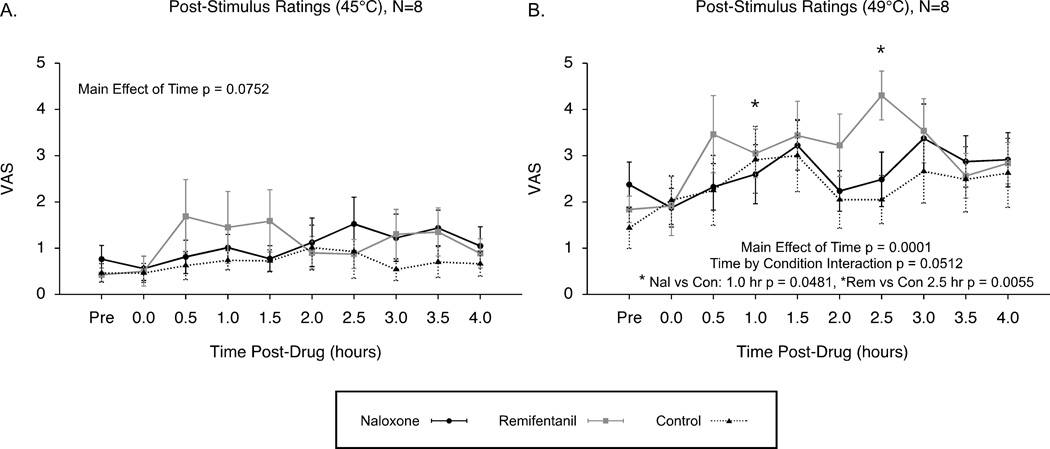
Figure 7. Post-stimulus VAS ratings: Opioid-induced hyperalgesia by remifentanil compared to naloxone and control conditions (N=8).
Post-stimulus VAS ratings to 45°C showed only a trend for increased sensitivity over time across the naloxone, remifentanil and control conditions (A). Post-stimulus VAS ratings to 49°C stimuli revealed significantly increased sensitivity over time for all conditions with a trend for opioid-induced hyperalgesia following remifentanil compared to the control condition (B). Mean ± SEM; VAS, visual analogue scale.

