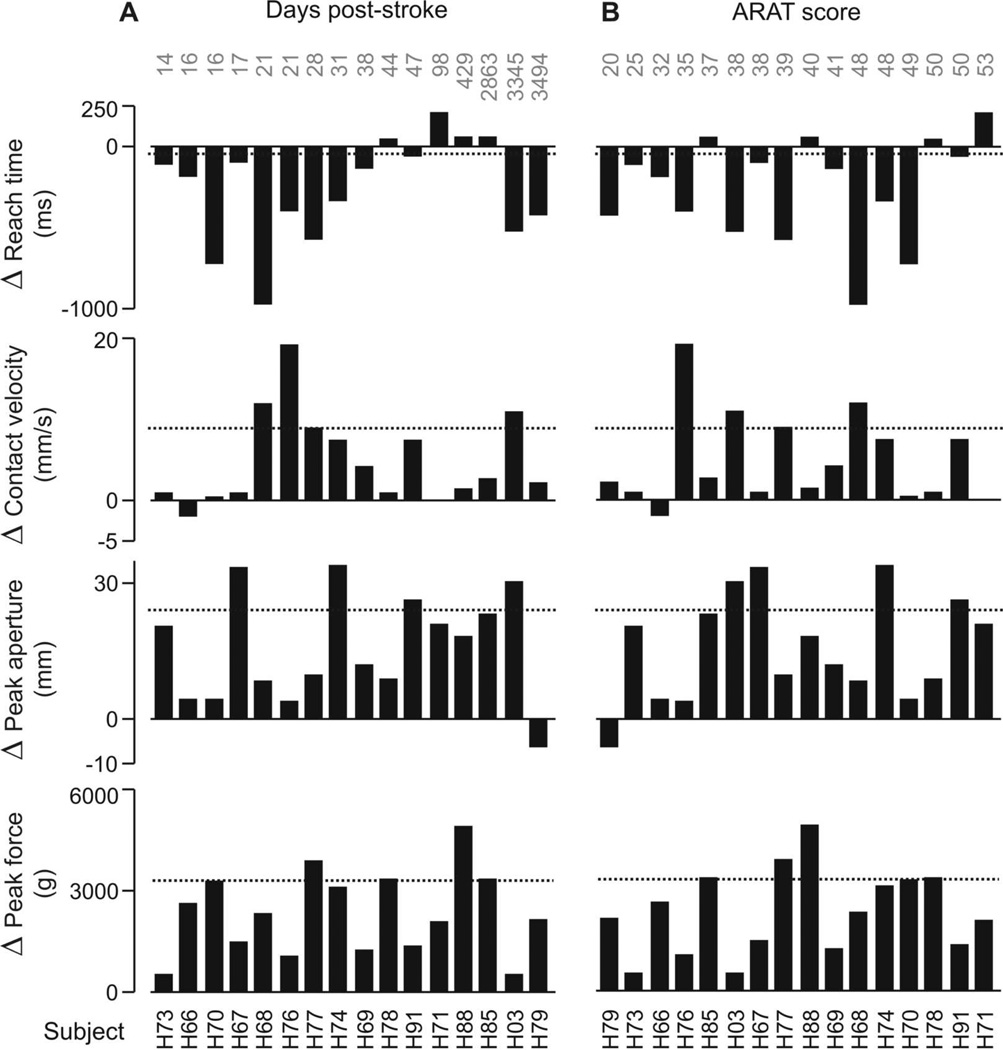
Figure 4.
Grip-related change in reach time, contact velocity, peak aperture, and peak force within each subject in the stroke group, collapsed across task goals. Change (Δ) is the difference in performance between the palmar and 3-finger grip types. Positive values indicate palmar > 3-finger; negative values indicate 3-finger > palmar. Subjects (e.g. H73, H66, etc.) are sorted along x-axis by increasing (A) number of days post-stroke and (B) score on ARAT (normal = 57), shown across top of graphs. Dashed line indicates mean change in the control group.

