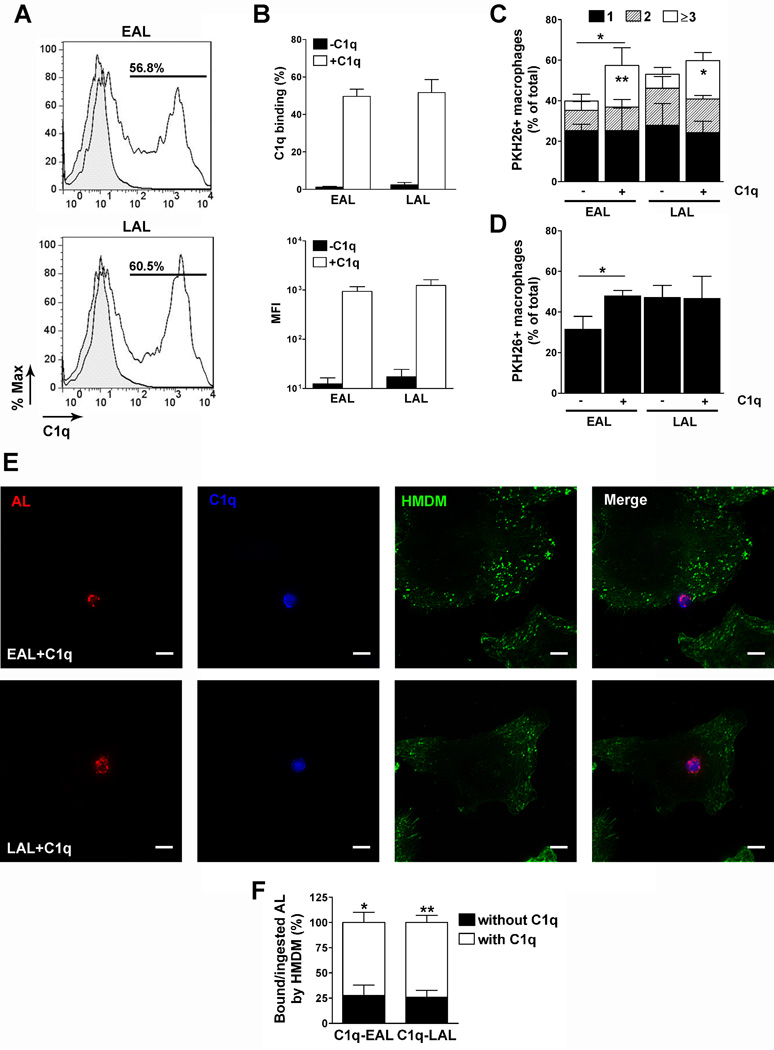
Figure 1. C1q binding to EAL and LAL and effect on the uptake by HMDMs.
(A and B) EAL and LAL were incubated without (gray peak) or with 150 µg/ml C1q (black lane) for 1 h, washed and stained for C1q. Representative FACS plot of multiple experiments are shown. (B) Percentage of C1q binding and anti-C1q MFI determined by flow cytometry. Results represent means ± s.d. (n = 5). (C–D) HMDMs were incubated with PKH26-labeled EAL and LAL, pre-incubated or not with C1q, at a 5:1 ratio for 1 h, washed and fixed. Cells were stained with FITC-phalloidin and analyzed by confocal microscopy (Fig. S2) to determine the percentage of phagocytosis and the number of targets per HMDMs (C) or stained with CD11c-FITC antibodies and analyzed by flow cytometry (D).Results represent means ± s.d. (n = 3 different donors), two-way ANOVA, * p < 0.05 and ** p < 0.01. (E–F) PKH26-prelabeled EAL and LAL (red) were incubated with C1q for 1 h, washed and then added to HMDMs at a 5:1 ratio for 1 h. Cells were fixed and stained with anti-C1q antibodies (blue) and FITC-phalloidin (green) and analyzed by confocal microscopy. Representative micrographs of 3 independent experiments are shown in E. Scale bar = 10 µm. (F) Percentage of HMDM-bound/ingested EAL or LAL bound or not to C1q. Results represent means ± s.d. (n = 3), two-way ANOVA, * p < 0.05 and ** p < 0.01.

