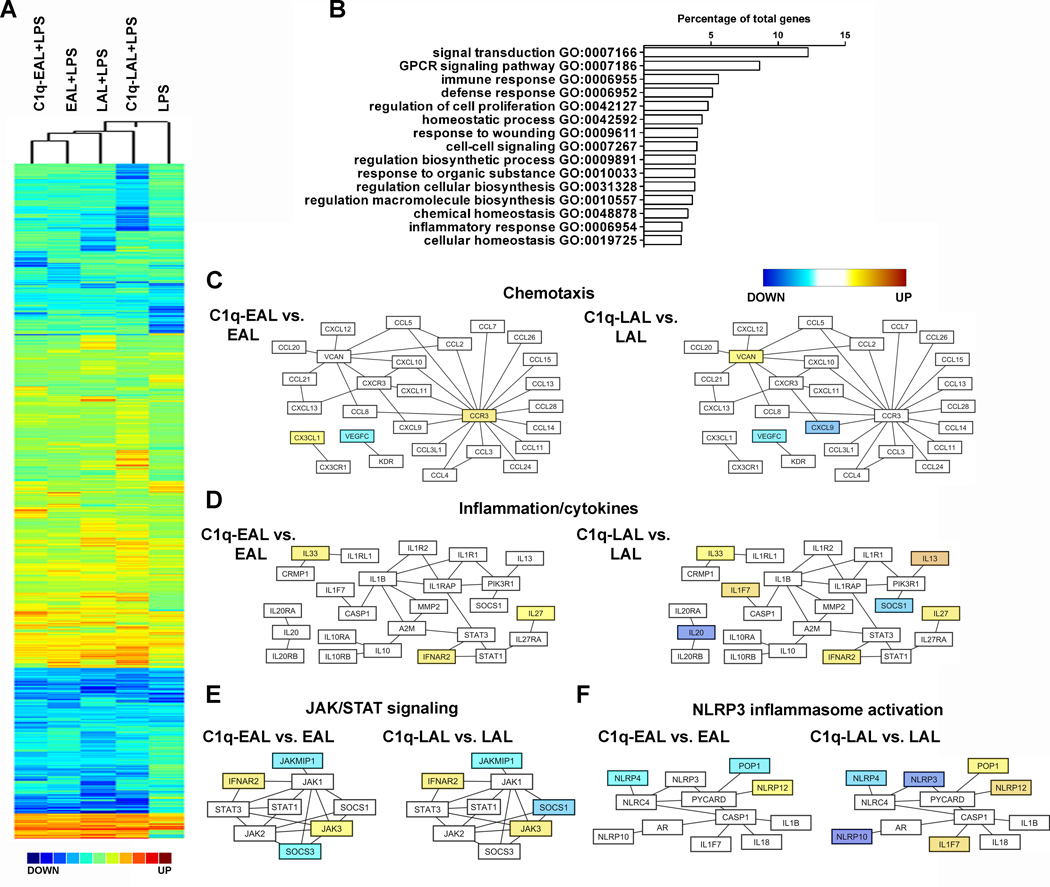
Figure 2. Gene expression and main biological processes modulated by C1q in HMDMs during the uptake of AL.
(A) Pearson correlation coefficient-based heat map (complete linkage method) representation of the Log2 fold-change (all conditions performed in triplicate) of HMDMs incubated with EAL, C1q-EAL, LAL and C1q-LAL and then stimulated with LPS for 3 h over unstimulated HMDMs. (B) GO-based functional annotation of genes modulated by C1q in HMDMs. Major biological processes are shown as the percentage of differentially expressed annotated genes (redundancy is due to the involvement of individual genes in multiple biological processes). (C–F) Network diagrams of chemotaxis (C), inflammation/cytokines (D), JAK/STAT signalling (E) and NLRP3 inflammasome activation (F) pathways modulated by C1q in HMDMs. Node colors represent changes in gene expression in C1q-EAL vs. EAL or C1q-LAL vs. LAL, shown using a color gradient (blue = down-regulated, white = not modulated and yellow = up-regulated by C1q).

