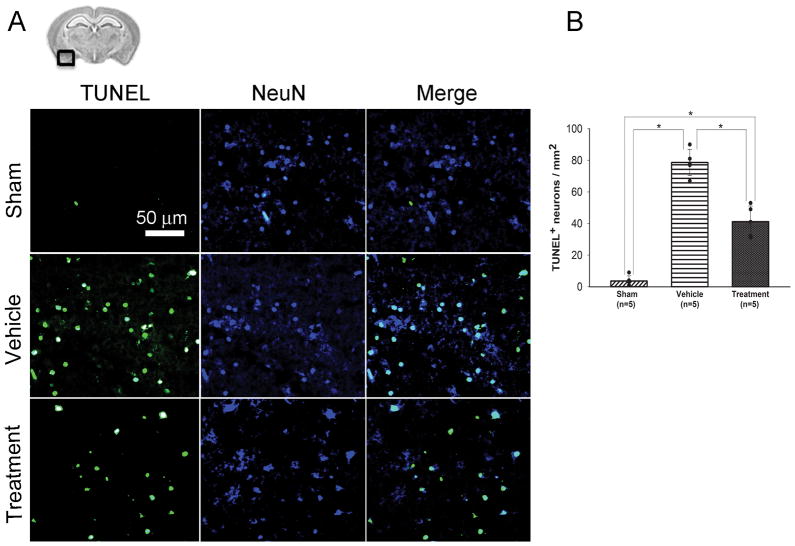
Figure 4.
Evaluation of TUNEL-positive cells in the ipsilateral basal cortex at 24 hours after SAH (study 1). A, representative brain section and immunofluorescence images showing the colocalization of NeuN (blue) with TUNEL (green)-positive cells; B, quantitative analysis of TUNEL-positive neurons. Scale bar, 50μm; values, mean±SD; *P<0.05, ANOVA.

