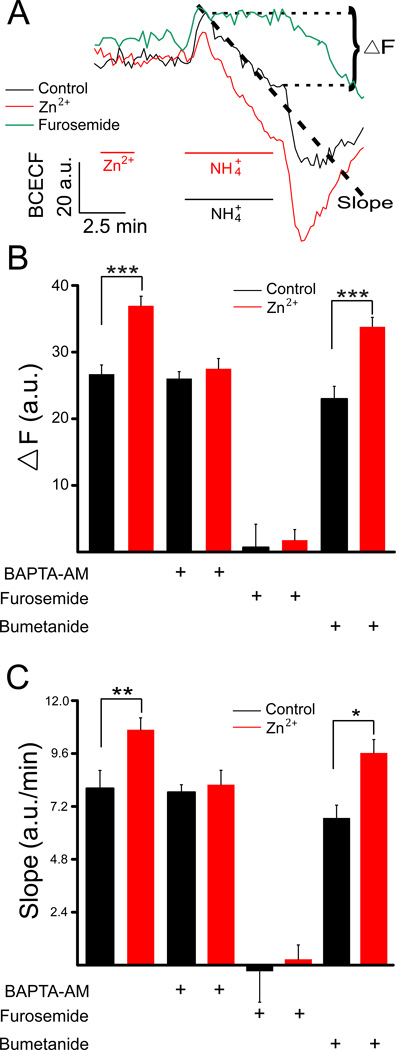
Figure 2.
Zn2+ enhances KCC2 co-transporter activity. (A) Average fluorescence change from rat cortical neurons from single coverslips loaded with the fluorescent pH indicator BCECF. Signals were obtained from control cells (black), as well as from neurons treated with 200 µM ZnCl2 for 2 min as shown (red). An example of a furosemide (100 µM)-treated preparation is also shown, as this drug inhibits the KCC2 activity and NH4+ transport (green). NH4+ transport, mediated by KCC2 (mean ± SEM), was quantified by calculating the slope during intracellular acidification. In addition, the net change in fluorescent signals (ΔF), as denoted in the figure, was measured. The slopes were calculated from the initial 200 s of acidification phase of the traces (Chorin et al., 2011). KCC2 activity, measured both in terms of ΔF (B) and slope (C), under control conditions and following Zn2+, was determined in cells exposed to vehicle (n’s=9,9), 13 mM BAPTA-AM (n’s=4,5), 100 µM furosemide (n’s=4,6), or 1 µM bumetanide (n’s=5–6); *P<0.05, **P<0.01, ***P<0.001 (unpaired t-test).

