
Figure 2.
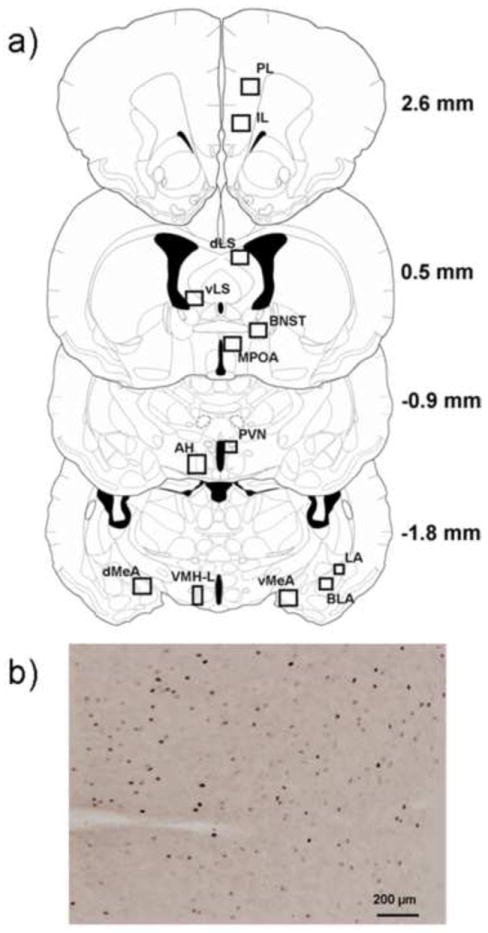
a) The diagrams indicate the location of brain regions selected for c-Fos quantification. The diagrams were modified from the hamster atlas of Morin & Wood and values indicate the distance from bregma (Morin and Wood, 2001). The box sizes used for quantification are as follows (width × height): 260 μm × 280 μm (LA); 440 μm × 400 μm (BLA); 325 μm × 650 μm (VMHL); 439 μm × 330 μm (PVN); 500 μm × 500 μm (dLS, vLS, BNST, MPOA); 870 μm × 660 μm (dMeA, vMeA, PL, IL, AH). b) Representative photomicrograph of the IL from a defeated hamster used for c-Fos quantification. Black dots represent c-Fos immunopositive nuclei.