
Figure 7.
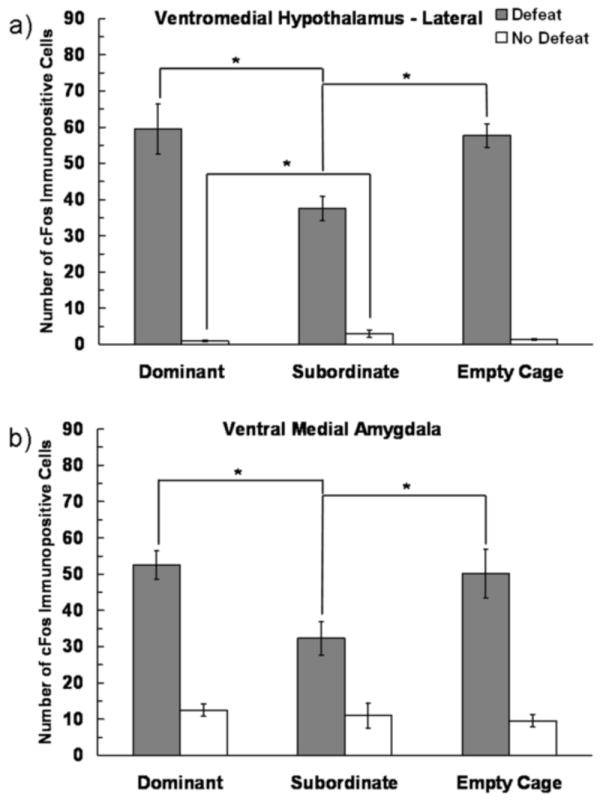
Number (mean ± SE) of c-Fos immunopositive cells in the VHML and vMeA measured following social defeat training. Subjects represented by gray bars received social defeat training, while subjects represented by white bars were non-defeated controls. We found a significant interaction between defeat experience and social status. An asterisk (*) indicates a significant difference between bracketed bars (P > 0.05).