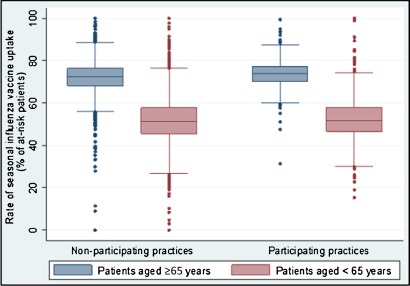
Figure 1.
Box and whisker plots showing the range and distribution of influenza vaccination uptake rates for patients aged 65+ years (blue boxes and bars) and at-risk patients aged under 65 years (red boxes and bars). The distribution of uptake rates for non-participating practices (N=2101) and participating practices (N=795) are not significantly different.

