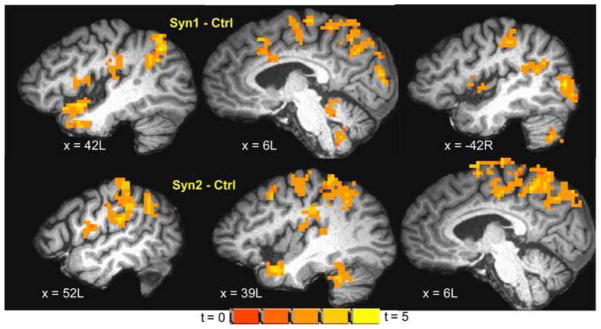
Figure 4.
Inter group differences (ANOVA t-contrast; cluster-level p < 0.05) in brain activation to noxious heat stimulation of ventrum of the right forearm overlaid on a representative subject’s spatially normalized high-resolution anatomic. Slice locations in RAI Talairach co-ordinates. (top) Syn1 – Ctrl showing increased activation to noxious heat in Syn1 in S1, S2, insula, IPL, SMA, PCL, BA7 and cerebellum; (bottom) Syn2 – Ctrl showing increased activation to noxious heat in Syn2 in similar regions.

