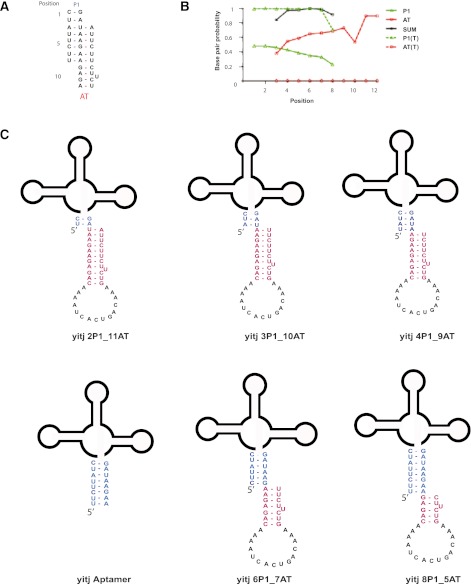
FIGURE 2.
(A) Schematic illustration of base-pair competition between P1 and AT helices. Positions of the base pairs are numbered from 1 to 12. Note that positions 1–2 can only form P1 helix pairs, while positions 9–12 can only form AT pairs. Positions 3–8 can form either. (B) Base-pairing probability (BPP) calculation for B. subtilis yitJ SAM-I riboswitch. For each position, the BPP is plotted for P1 helix base pairing (green), AT pairing (red), the sum of the two (black) for transcripts truncated at the 3′ end of the AT helix (solid) or at the 3′ end of the terminator helix (broken lines) (C) B. subtilis yitJ SAM-I riboswitch AT and aptamer hybrid constructs used for SAM binding studies.

