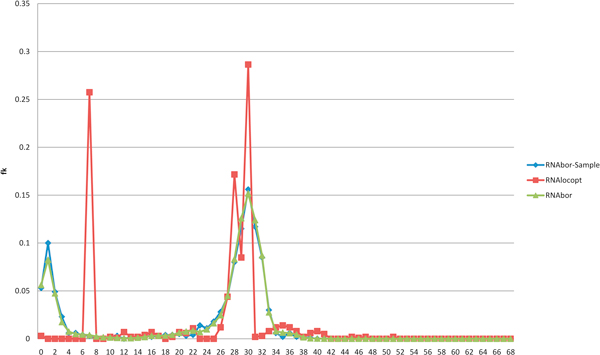
Figure 2.
Boltzmann density plot for RNAbor, along with approximating relative frequency plots for RNAborMEAandRNAlocoptfor the 101 nt RNA sequence UACUUAUCAA GAGAGGUGGA GGGACUGGCC CGCUGAAACC UCAGCAACAG AACGCAUCUG UCUGUGCUAA AUCCUGCAAG CAAUAGCUUG AAAGAUAAGU U for the SAM riboswitch aptamter with GenBank accession code AP004597.1/118941-119041. The program RNAbor computes the Boltzmann probability , where , where S0 is the initial structure (taken as the minimum free energy here). The script RNAbor-Sample calls Sfold on 1000 structures, in order to compute a relative frequence fk ≈ pk of all k-neighbors of S0. Finally, we compute relative frequency of RNAlocopt[34], a program that samples only locally optimal secondary structures, having the property that one cannot obtain a lower energy structure by adding or removing a single base pair.

