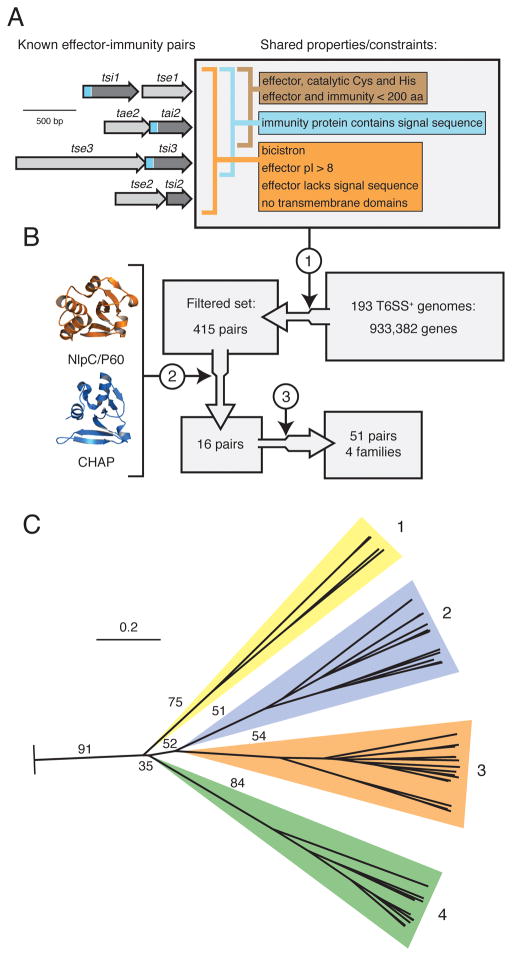
Figure 3. Identification of a T6S effector superfamily.
(A) Overview of shared T6S EI pair properties. Depicted at left are the four bicistrons encoding all characterized EI pairs (this study and (Hood et al., 2010; Russell et al., 2011)). Properties are divided among those shared by all EI pairs (orange), periplasmically-targeted pairs (blue), and amidase pairs (brown). Sequences encoding signal peptides within immunity proteins are represented in blue.
(B) Schematic of informatic effector identification workflow. Key steps in the workflow are indicated: 1) filter by constraints depicted in (A), 2) application of structure prediction criteria, 3) expansion by homology searching of the non-redundant nucleotide database.
(C) Phylogenetic tree of T6S effectors identified by the methods depicted in A and B. The tree was based on alignment of catalytic motifs (Figure S3). Effectors distribute into four branches, referred to as Families 1–4. The background colors assigned to the families are used henceforth. Critical boostrap values are indicated (n = 100). The tree was rooted using equivalent catalytic motifs of papain-like fold enzymes (Pfam clan, CL0125). Scale bar indicates evolutionary distance in amino acid substitutions per site.

