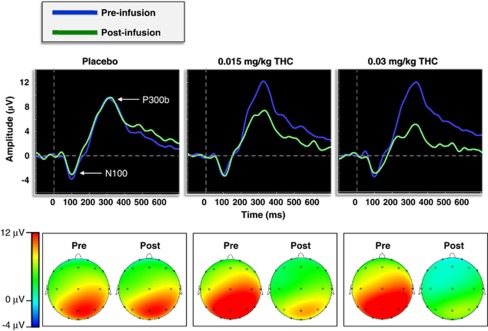
Figure 1.
(Top) Grand-averaged target P300b waveforms at electrode Pz for both the pre- and post-infusion electroencephalography (EEG) runs across dose conditions. (Bottom) Topographic voltage maps from the peak grand-averaged P300b for both the pre- and post-infusion EEG runs across dose conditions.

