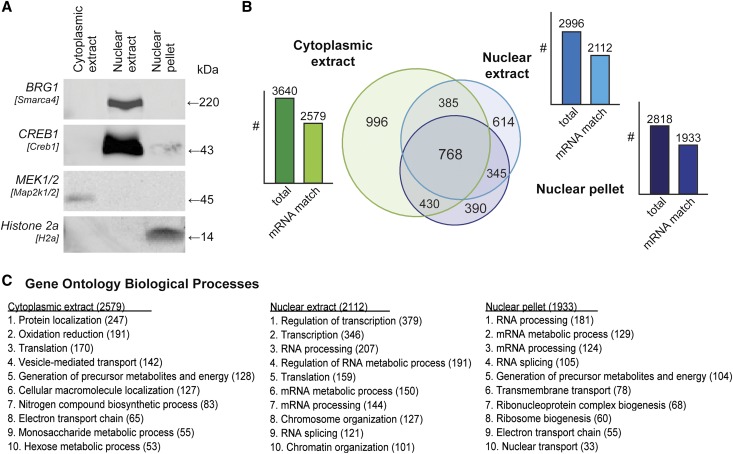
Figure 1.
Nucleo-cytoplasmic separation and LC-MS/MS profiling. (A) Immunoblot of marker proteins for each subcellular compartment, labeled by common name with the gene symbol in brackets. (B) Venn diagram of common and unique proteins identified in cellular fractions. Bar graph represents the number of all proteins (left bar) and the number of proteins that have corresponding mRNA transcripts (right bar) in each cellular fraction. (C) Ten most frequent Biologic Processes terms (Gene Ontology) among identified proteins (count given in brackets, all false discovery rates<25%, all P<0.001).

