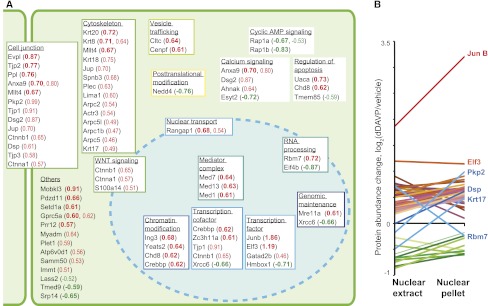
Figure 3.
Proteins significantly changed in nuclear abundance. (A) Protein groupings were hand curated based on Gene Ontology terms, Swiss-Prot protein annotations, and Panther protein classes for each protein. Quantification results are given in parentheses as average log2(dDAVP/vehicle) for proteins meeting the dual statistical criterion (P<0.05 in t test and outside 95% CI derived from vehicle versus vehicle experiment). Values in bold refer to changes in the nuclear extract, and nonbold values refer to changes in the nuclear pellet. (B) Corresponding quantification results in nuclear extract and nuclear pellet for all proteins meeting the dual criterion in at least one of the nuclear fractions. For details, see Supplemental Tables 6 and 7.

