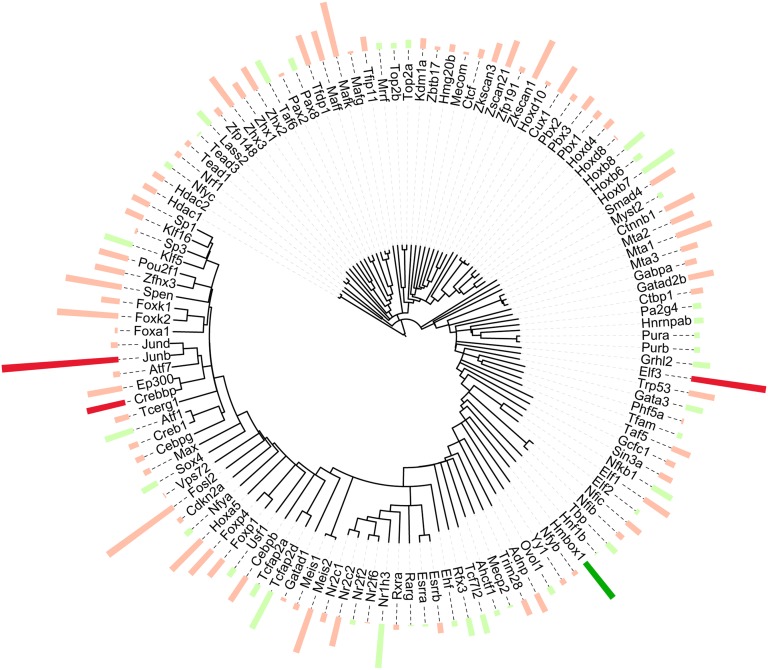
Figure 5.
Sequence-specific DNA binding transcription factors detected in the nuclear extract. A dendrogram showing proteins quantified in the nuclear extract that matched the Gene Ontology Molecular Function term “sequence-specific DNA binding transcription factor activity” aligned by amino acid sequence similarity (entire protein). The bars indicate quantification results, averages of |log2(dDAVP/vehicle)| >0 (red, increased; green, decreased). Bold colors implicate a significant difference meeting the dual criterion discussed above.

