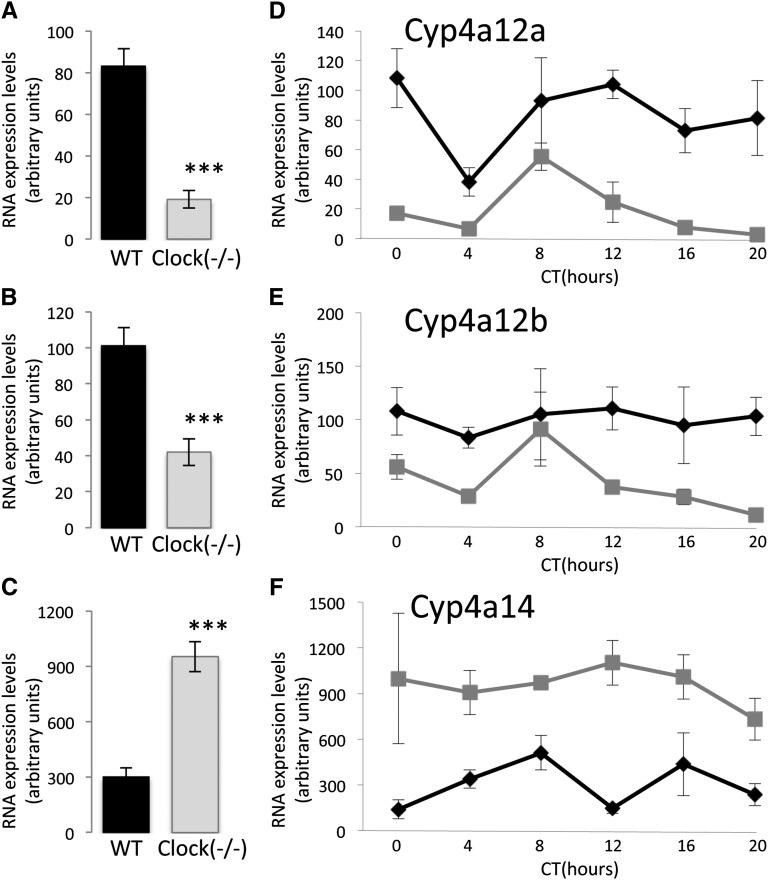
Figure 4.
Expression levels of Cyp4a12a, Cyp4a12b, and Cyp4a14 transcripts in kidneys of wild-type and clock(−/−) mice. (A–C) Real-time PCR–based quantitation of 24-hour mean expression levels of Cyp4a12a, Cyp4a12b, and Cyp4a14, respectively. Values are means ± SEM from 30 mice. ***P<0.001, two-way ANOVA. (D–F) Real-time PCR–based temporal profiling of Cyp4a12a, Cyp4a12b, and Cyp4a14 RNA expression in kidneys of wild-type (black line) and clock(−/−) (gray line) mice, respectively. Values are means ± SEM from five mice.

