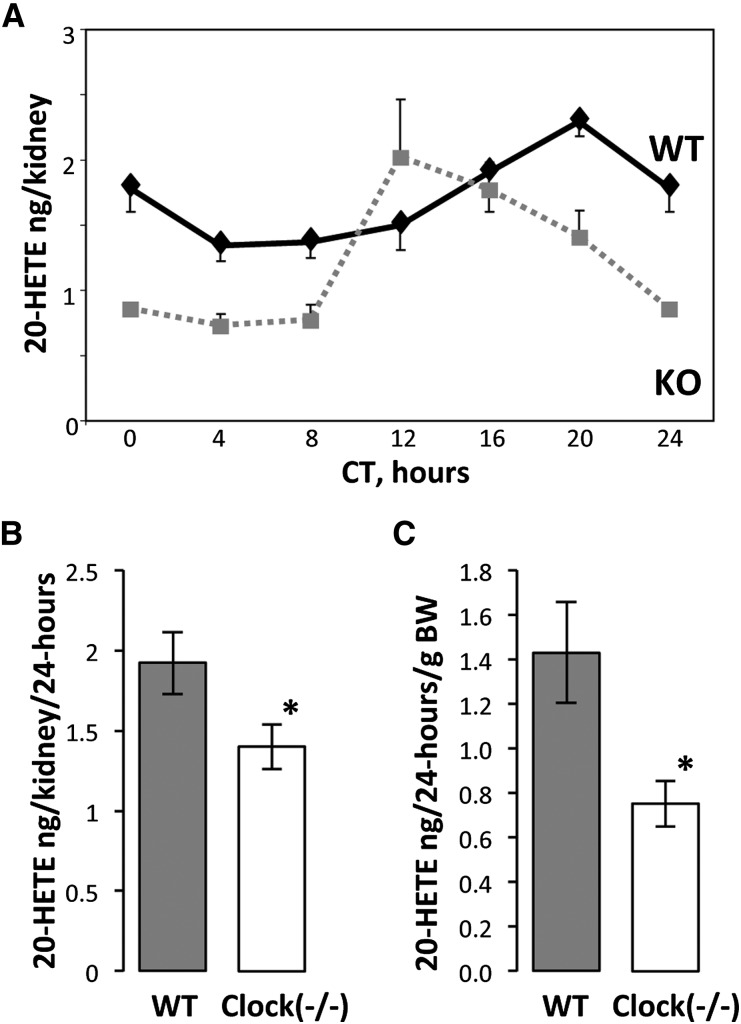
Figure 5.
The clock(−/−) mice exhibit a significant reduction in 20-HETE levels in kidney microsomes and in urine. (A) Temporal profiles of 20-HETE levels in kidney microsomes of wild-type (black lane) and clock(−/−) mice (gray lane). Values are means ± SEM from six mice. KO, knockout; WT, wild-type. (B) Twenty-four–hour mean 20-HETE levels in kidney microsomes. Values are means ± SEM from 35 mice. *P<0.05, two-way ANOVA. (C) Twenty-four–hour mean 20-HETE levels in the urine of wild-type and clock(−/−) mice. Values are means ± SEM from six mice. BW, body weight. *P<0.05, t test.

