Figure 6.
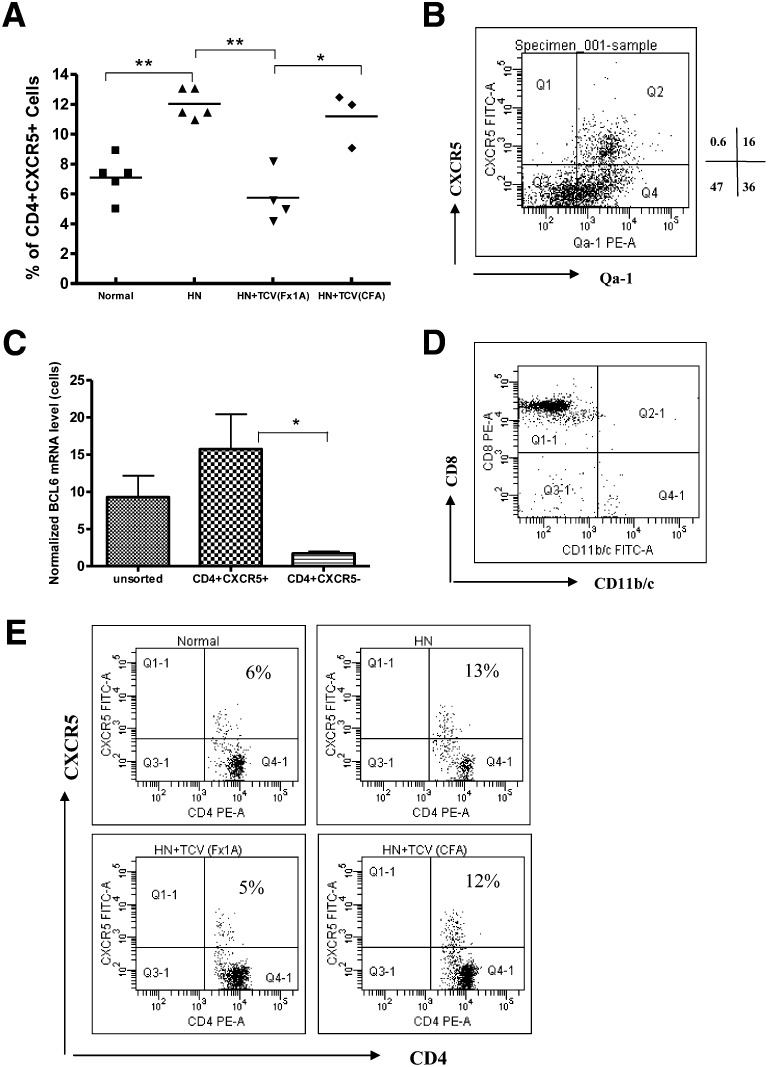
Characterization of TFH cells in HN. (A) Splenocytes were isolated from CFA and HN rats and analyzed by flow cytometry to assess the percentage of TFH cells between control (CFA injected) and HN (Fx1A treated) rats. There were significantly higher numbers of the CD4+ CXCR5+ TFH cells in HN rats than in the CFA group (*P<0.05; **P<0.01). (B) After gating on CD4+ cells, Qa-1 was highly expressed on CXCR5+ TFH cells (96% of total CD4+ cells). (C) Sorted CD4+ CXCR5+ TFH cells expressed a higher level of BCL6 mRNA than CD4+CXCR5− T cells by real-time PCR (*P<0.05). (D) Splenocytes were isolated from rats with HN and TCV, and then, sorted CD8+ T cells were analyzed by flow cytometry (purity>92%). The sorted CD8+ T cells were then stained with CD11b/c with limited CD11b/c expression. (E) Flow cytometric analysis showed TFH cells (CXCR5+ CD4+ T cells) increased to 12% after HN induction compared with normal rats (5% CXCR5+ of total CD4+ T cells); there is a significant decrease in TFH numbers in HN rats receiving TCV induced with Fx1A. However, HN rats receiving TCV induced with CFA had a similar increase in TFH cells (10%) as HN rats alone (n=6).

