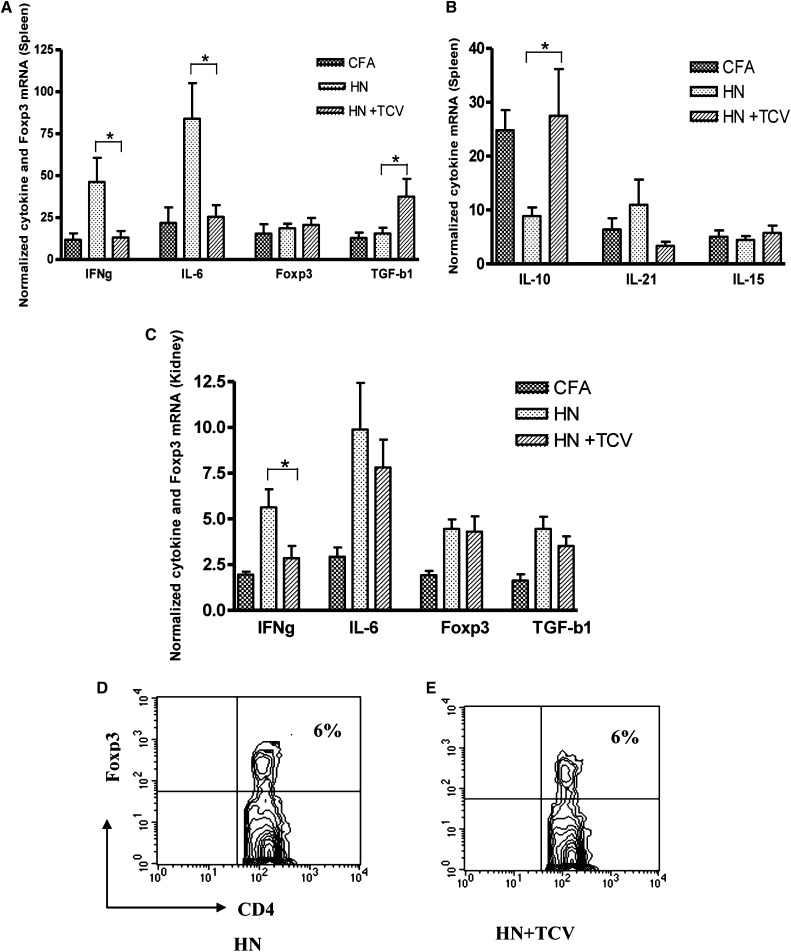
Figure 7.
Real-time quantitative PCR of cytokine and Foxp3 mRNA levels from splenocytes and kidney 12 weeks postimmunization with Fx1A. (A and B) HN + TCV rats had significantly lower levels of IL-6 and IFN-γ and higher levels of TGF-β and IL-10 than (A) splenocytes from HN rats (*P<0.05). (C) There was higher level of IFN-γ in kidney for HN + TCV rats compared with HN rats (*P<0.05). Splenic Foxp3 mRNA level was not different among the three groups of rats. Flow cytometric analysis showed no difference in Foxp3+ Treg numbers in circulation between (D) HN and (E) HN + TCV groups.

