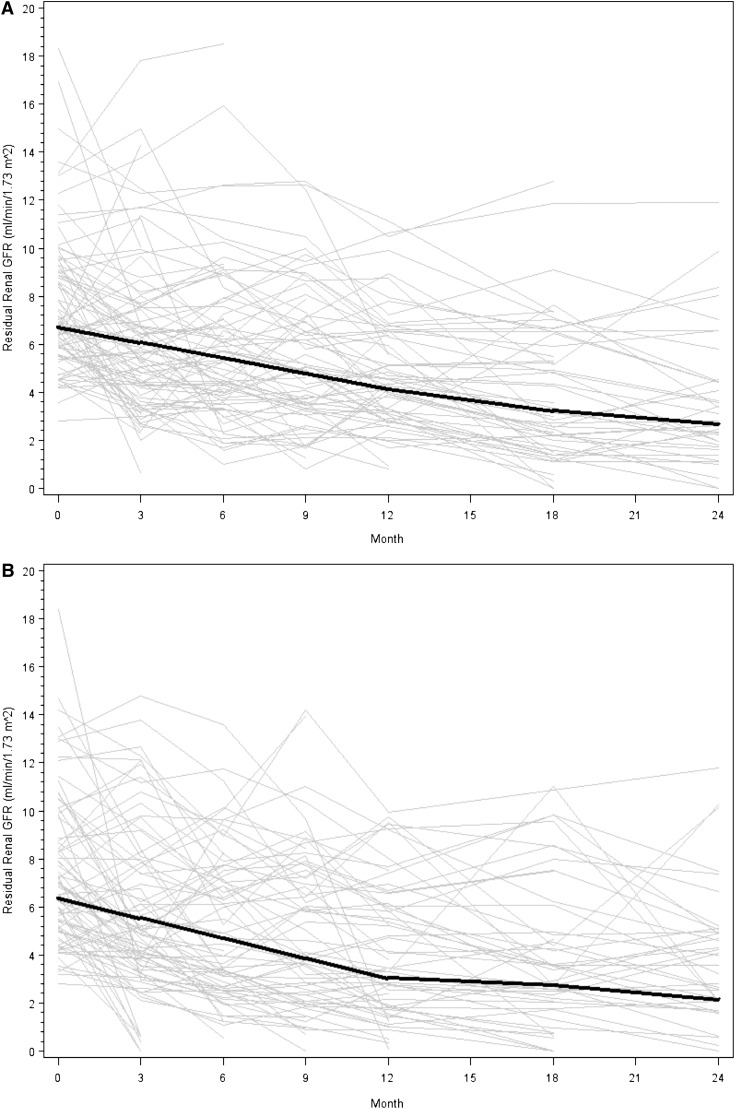
Figure 2.
Nonsignificant difference in residual renal function decline over 2 years in the biocompatible and control groups. (A) The biocompatible group. (B) Controls. Gray lines represent individual patient measurements, whereas solid lines represent predicted slopes in the first and second 12-month follow-up periods. The P value for the three-way interaction of year (first 12 months versus second 12 months) by GFR slope by dialysate was 0.06.

