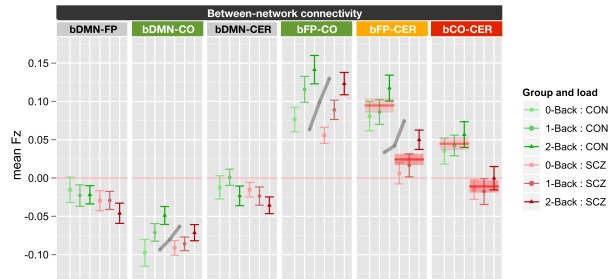
Figure 5.
Graph illustrating between network connectivity as a function of working memory load collapsed across siblings. SCZ, individuals with schizophrenia and siblings of individuals with schizophrenia; CON, healthy controls and siblings of healthy controls; DMN, Default Mode Network; FP, Frontal–Parietal Network; CO, Cingulo-Opercular Network; CER, Cerebellar Network; b, between. Segments marked in green indicate networks that showed significant main effects of working memory load (0B, 1B, 2B) and the gray lines further illustrate the significant main effect of load across groups (mean across groups). Segment marked in orange showed both a significant main effect of load and a significant main effect of genetic liability (SCZ versus CON). The segment marked red indicates the network that showed only a significant main effect of genetic liability (SCZ versus CON). The red lines further illustrate the statistically significant effects of genetic liability (mean and standard error for each group across memory loads). See Figure S7 in Supplementary Material for data plotted for each of the four groups separately.

