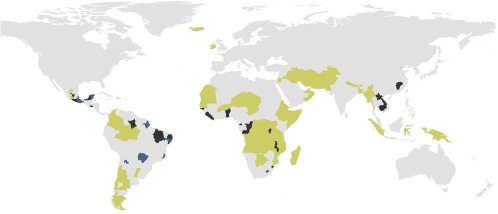
Fig. 3.
Global hotspots of discovery as measured by the difference between the predicted and known diversity of ant genera. Regions where a minimum of 20 new records of genera are expected in both models appear in black. Regions with at least 20 new records of genera are predicted in the interpolation model (but not the environmental model) appear in blue. Regions with at least 20 new records of genera are predicted in the environmental model (but not the interpolation model) appear yellow-green.

