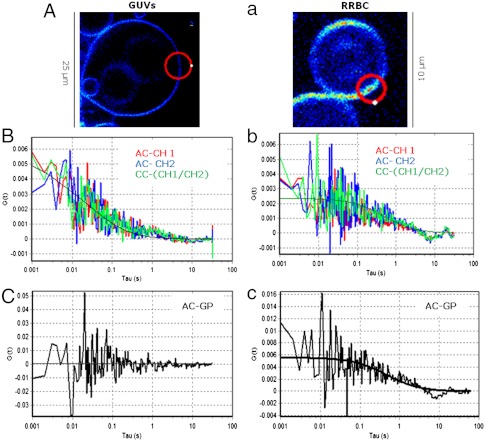
Fig. 2.
Representative results for Laurdan GP fluctuations for the control POPC at 25 °C (A–C) and RRBC at 37 °C (a–c). (A, a) Intensity images taken at the equatorial section show the location of the laser orbit (red circle) used to perform sFCS measurements. The orbit crosses twice the bilayer (see Methods), starts and finishes at the white point and moves clockwise. (B, b) Autocorrelation (AC) analysis applied to the independent channels (AC-CH1 in red and AC-CH2 in blue) together with the cross-correlation of the two channels (in green). (C, c) AC function applied to the pixels corresponding to the membrane on the GP carpet (AC-GP). Solid lines correspond to the fitting of the experimental data. For detailed explanations see Methods.

