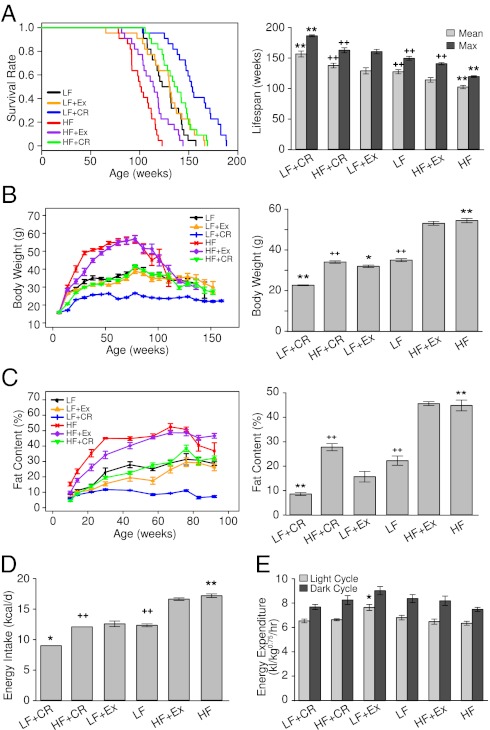
Fig. 1.
Effects of diet and Ex on lifespan and energy state. (A, Left) Kaplan–Meier survival curves (n = 22 per group) showing significant changes in lifespan between intervention pairs of HF/LF (P = 0.9E-6), HF+CR/HF (P = 0.87E-9), HF+Ex/HF (P = 0.006), and LF+CR/LF (P = 0.42E-5) by log-rank test. (A, Right) Mean and maximum lifespan of mice in the six intervention groups as derived from the Kaplan–Meier survival curves. Maximum lifespan was calculated from the average of the oldest 20% of mice in each group. (B) Body weight was monitored throughout the (Left) indicated ages and (Right) midlife (62-wk age) until the number of mice alive in each group was less than six. (C) Total body fat content was measured by NMR (n = 8–10 per group) at (Left) each indicated age and (Right) midlife (62-wk age) until 92 wk of age. (D) Energy intake was calculated based on the daily food consumption of mice during the intervention before 62 wk of age (n = 8 per group). (E) Oxygen consumption was determined at midlife when mice were 57–58 wk of age (n = 5 per group). Data in B–D are presented as means ± SEM. *P < 0.05, **P < 0.01 vs. LF, ++P < 0.01 vs. HF by ANOVAs.

