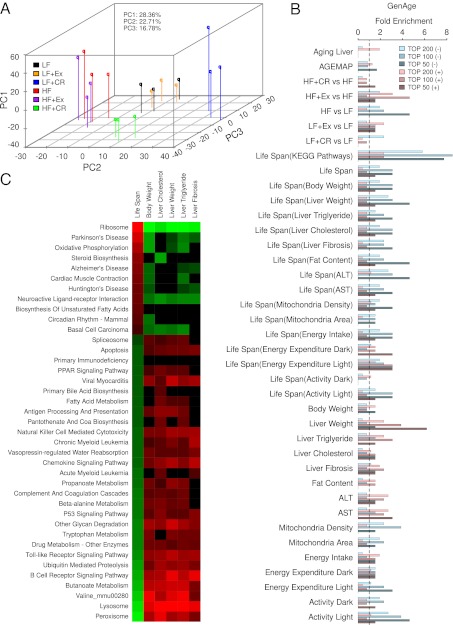
Fig. 3.
Midlife liver gene expression correlations to lifespan are predictive of aging regulators. (A) PCA analysis of the profiles of the differentially expressed genes (Materials and Methods and Dataset S1) for the indicated 18 samples. (B) Fold enrichment over genome-wide background for aging regulatory genes from GenAge database among the top 50, 100, or 200 genes with expressions that are most positively (+) or negatively (−) correlated with lifespan or liver physiological parameters. Enrichments are shown for genes in pathways significantly positively/negatively correlated with lifespan with (as indicated by the labels inside parentheses) or without prefiltering for significant correlation with other phenotypes. Significance of correlations was determined by PCCs (P < 0.05). (C) The KEGG pathways with gene expressions that significantly correlated or anticorrelated with the physiological parameters identified by the GSEA analysis.

