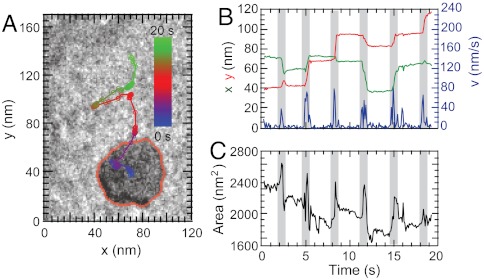
Fig. 2.
Dynamics of a moving nanodroplet. (A) Path traced by the droplet during 19.2 s, during six steps. The droplet boundary is traced with red line (see Movie S2). (B) x (green curve), y (red curve) position and instantaneous velocity (blue curve) of the droplet’s centroid position illustrate distinct steps taken during the translocation. (C) With each step the nanodroplet elongates as illustrated by the change in area versus time. The gray-shaded regions in graphs (B) and (C) highlight the slipping events.

