Fig. 4.
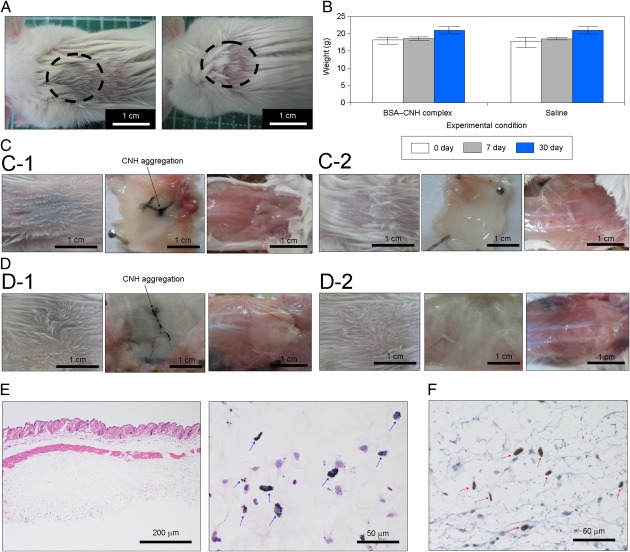
Biocompatibility of CNH complexes. (A) A mouse’s back after immediate injection of BSA–CNH complexes (Left) and saline (Right). (B) Weight changes in mice with or without CNH complex injection. (C) A mouse’s back and anatomic skin tissue at 7 d after BSA–CNH complex dispersion (C-1) and saline (C-2) injections. (D) A mouse’s back and anatomic skin tissue at 30 d after BSA–CNH complex dispersion (D-1) and saline (D-2) injections. (E and F) Pathological analysis of skin tissue after CNH complex injection. (E) Optical microscopy images of skin tissue of mice dissected at 30 d after injection of CNH complexes under the skin. (H&E staining; original magnification: left, 10×; right, 60×.) Blue arrows indicate CNH agglomerates. (F) Immunohistochemical detection of macrophages in s.c. tissue of mice dissected at 30 d after injection of CNH complexes under the skin. (Original magnification: 60×.) Red arrows indicate CNH agglomerates with adjacent macrophages.

