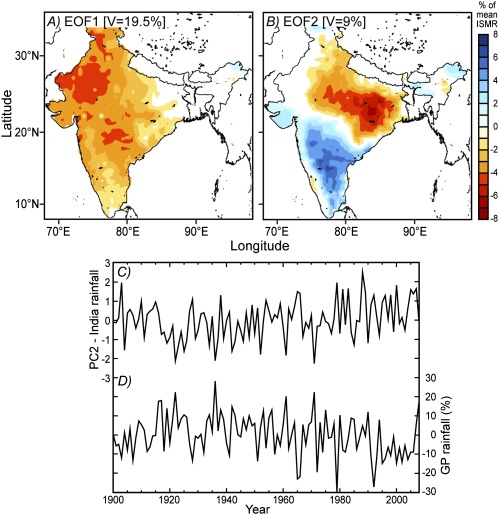
Fig. 2.
(A and B) The two leading EOFs of JJAS ISMR variability for the 109-y period from 1900 to 2008. Shading indicates the rainfall anomalies, expressed as a percentage of the climatological mean ISMR, observed in association with a PC amplitude of +1 SD. V indicates the fraction of the domain-integrated variance explained by the two modes. (C) The standardized PC2 (the time series of the expansion coefficient of EOF2) and (D) monsoon season rainfall averaged over the Gangetic Plain (21° N to 30° N, 75° E to 89° E) expressed as a percentage of the climatological mean rainfall.

