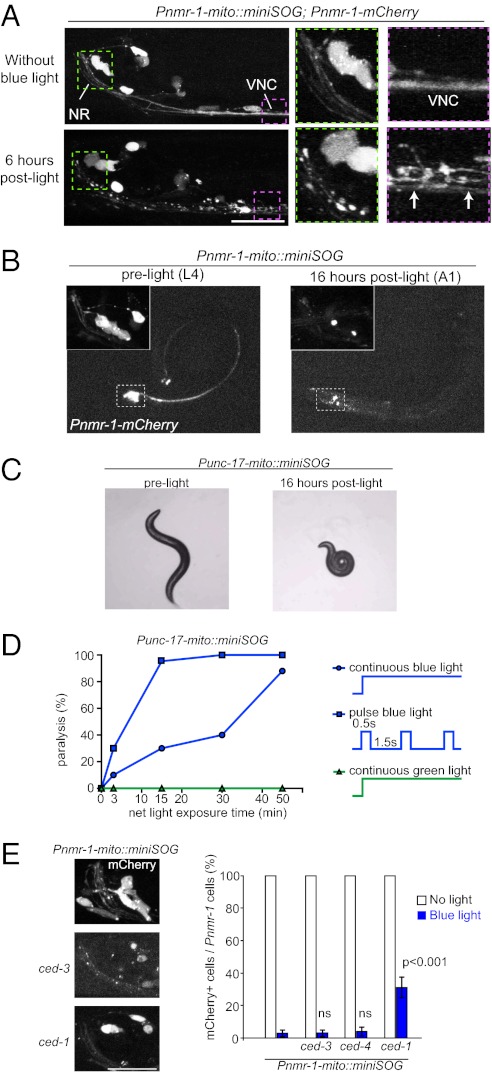
Fig. 2.
Time course and light dose of cell ablation by activated mito-miniSOG. (A) Dying cells following photo-activation of mito-miniSOG. Shown are confocal images of the head region (NR, nerve ring) and anterior ventral nerve cord (VNC) of the animals 6 h after blue-light exposure. In green and pink dotted frames are the blow-up views of the same worm. Dying cells viewed by mCherry show swelling of soma and fragmentation of nerve bundles of VNC (arrows). (Scale bar, 10 μm.) (B) Light-induced cell ablation in transgenic Pnmr-1-mito-miniSOG animals 16 h post light illumination. (Insets) Enlarged views of mCherry in Pnmr-1 neurons before light illumination and disappearance of mCherry-labeled cells. (C) Ablation of Punc-17β–expressing cells (DA, DB, VA, and VB motor neurons) by mito-miniSOG causes paralysis. (D) The graph shows that light dosage correlates with the percentage of paralysis induced by mito-miniSOG upon illumination under continuous or pulsed light. A total of 20–30 animals were analyzed for each data point. (E) Ablation of Pnmr-1 cells by mito-miniSOG is independent of ced-3 or ced-4; the clearance of damaged cell bodies and processes is partially blocked by ced-1. A total of 20–40 animals of each genotype were analyzed. (Scale bar, 10 μm.) Statistics used two-tailed Student’s t test. Error bar shows SEM. Data for ced-3, ced-4, and ced-1 are compared with the data for the same transgene in wild-type background.

