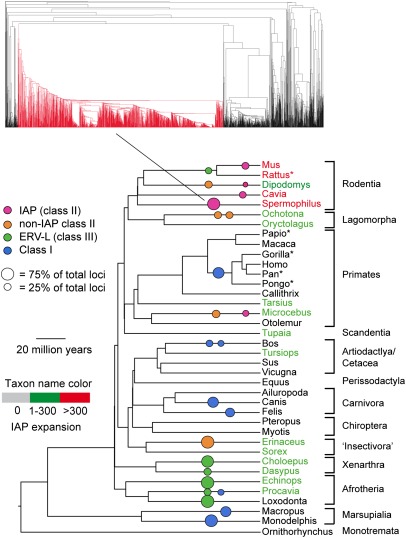
Fig. 1.
Phylogeny of mammals (57) with ERV megafamilies (see text) shown as colored circles (area is proportional to the percentage of the ERV loci in the genome represented by that family). The placing of megafamilies on the tree shows relative age but not origin (which may be considerably earlier). Scale bar shows approximate dates in host phylogeny. Asterisked taxa are treated as duplicates and excluded from our analysis of all ERV families. Name color shows how many IAP loci were found in each species (Table S1). A typical megafamily in one genome (Spermophilus) is shown colored red.

