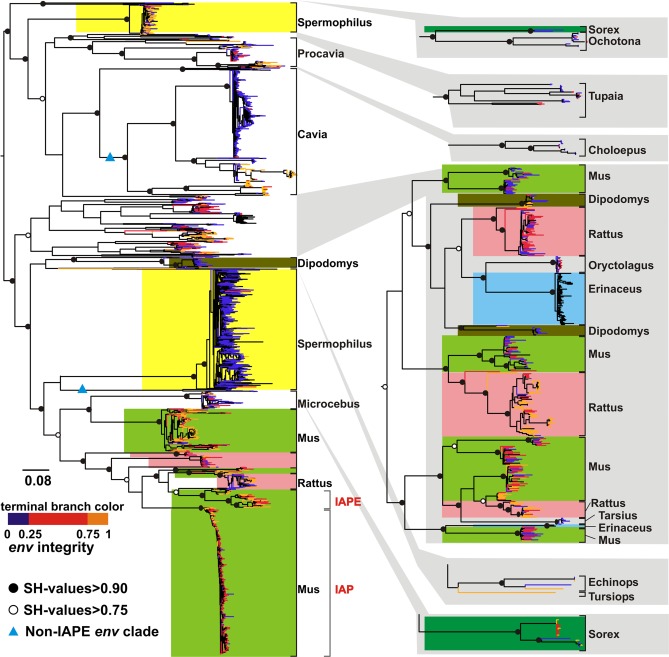
Fig. 2.
Phylogenetic tree of IAP loci. Expansions in host species that have had multiple invasions are colored. Integrity of env gene is shown by color of terminal branch: orange indicates the longest ORF (at least 75% of the full length); red indicates an ORF between 25 and 75% of the full length; blue indicates an ORF <25% of the full length. Black shows loci for which we could not extract sequences >13 kb. Solid and open circles show Shimodaira–Hasegawa (SH) support values > 0.90 and >0.75, respectively. The two blue triangles show switches of env. The published IAPE and IAP sequences are indicated.

