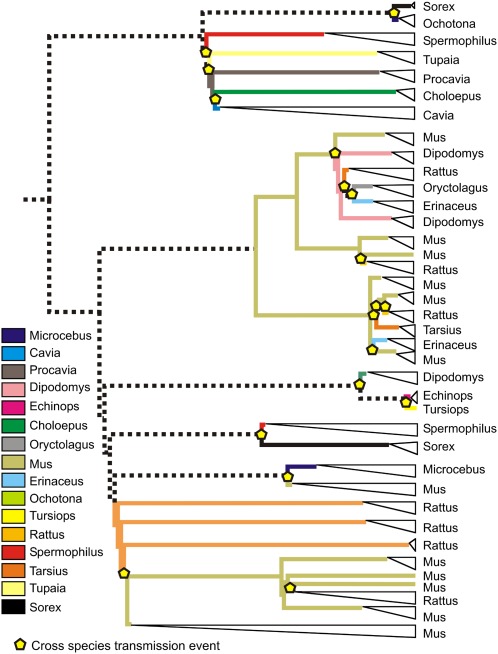
Fig. 3.
Phylogenetic tree of the IAPs with the inferred ancestral states of their host species. Expansions are collapsed into single taxa (white triangles), and cross-species transmission events are indicated by yellow pentagons. Colored lines show ancestral states that, according to the available host sampling, can be attributed to a single host. Dashed lines show ancestral states that could not be resolved.

