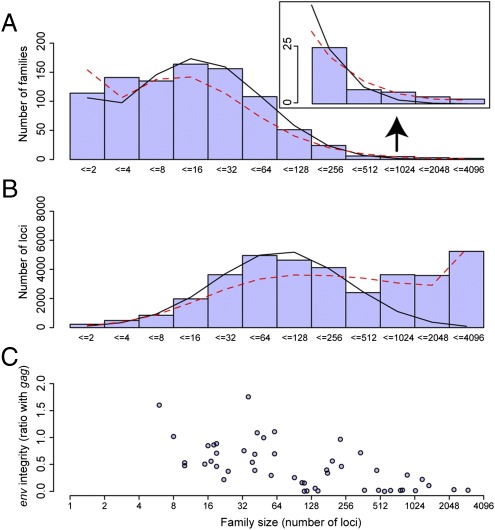
Fig. 4.
Histograms showing (A) how common are ERV families of different size (Inset shows right-hand tail expanded for clarity) and (B) how many loci in total are in these families. Lines are generated assuming a lognormal (solid black) or generalized Pareto (dashed red) distribution. (C) env integrity (relative to gag) for megafamilies and randomly selected smaller families. The horizontal axes have been scaled using the logarithm to base 2.

