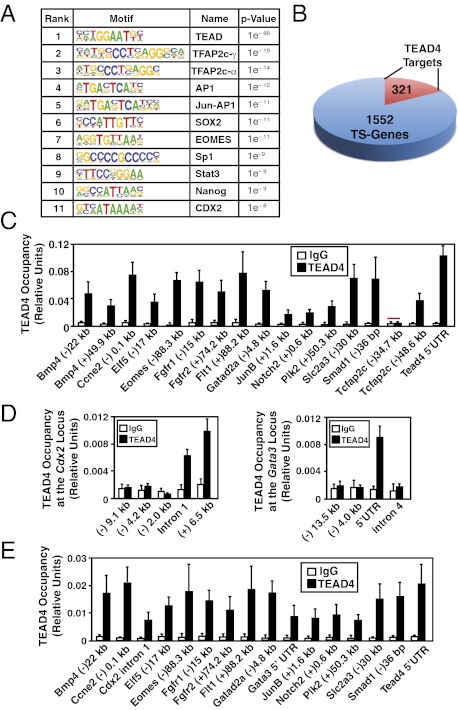
Fig. 1.
Direct regulation of core TSC genes by TEAD4. (A) HOMER analysis shows most abundant transcription factor-binding motifs at the ChIP-seq–identified TEAD4 binding regions along with log P values. (B) Pie chart shows numbers of core mTSC-specific genes with identified TEAD4 binding regions within ±50 kb of the transcription start site. (C) Quantitative ChIP analyses (mean ± SE; n = 3) shows TEAD4 chromatin occupancy at 18 regions that were identified by ChIP-seq analysis. The red bar shows a region in which TEAD4 occupancy was not detected. (D) ChIP analysis shows TEAD4 occupancy (mean ± SE; n = 3) at Gata3 and Cdx2 loci in mTSCs. (E) ChIP analyses (mean ± SE; n = 3) in mouse blastocysts show TEAD4 occupancy at the chromatin domains of mTSC-specific genes, including Gata3 and Cdx2.

