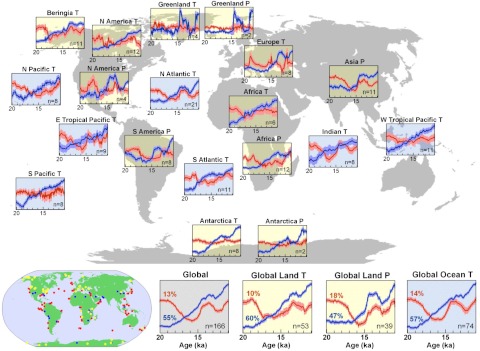
Fig. 4.
Regional and global principal components (PCs) for temperature (T) and precipitation (P) based on records shown on map in lower left. Red dots on map indicate sites used to constrain ocean sea-surface temperatures, yellow dots constrain continental temperatures, and blue dots constrain continental precipitation. PC1s are shown as blue lines, PC2s as red lines. We used a Monte Carlo procedure to derive error bars (1σ) for the principal components which reflect uncertainties in the proxy records. All records were standardized to zero mean and unit variance prior to calculating EOFs, which is necessary because the records are based on various proxies and thus have widely ranging variances in their original units (SI Appendix).

