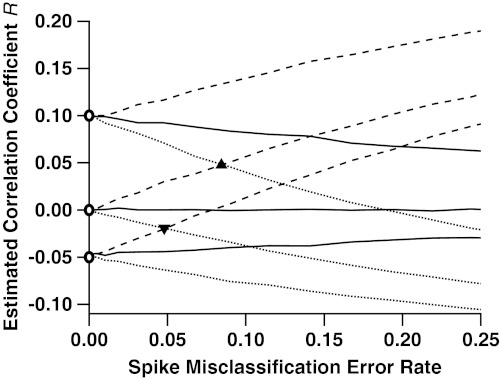
Fig. 2.
Correlation estimates of true correlations -0.05, 0, and 0.10, as functions of the rate of misclassified spikes. Pairs of spike trains were simulated according to three different gamma interval processes: k = 1 (Poisson, solid lines); k = 0.5 (more bursty, dashed); and k = 2 (more periodic, dotted). These processes mimic the inter-spike-interval (ISI) distributions seen in experimental data (22), classically characterized by the coefficient of variation CV = k-1/2. For each of the three cases, we simulated three different values of true correlation between spike trains: 0.1, 0, and -0.05, marked by the open circles along the y axis. Across the x axis we vary the rate at which a traditional spike-sorting procedure misclassifies spikes, the arithmetic mean of type 1 and type 2 errors. As this error rate increases, the estimation of correlation diverges from its true value. In the Poisson case, the bias is always towards an estimate of zero correlation. In the bursty case, it is always positive, and in the periodic case it is always negative. Also indicated are the rates of misclassification at which an uncorrelated (ρ = 0), bursty (k = 0.5), pair of cells has estimated correlation indistinguishable from a correlated (ρ = 0.1), periodic (k = 2), pair of cells (triangle); and the misclassification rate at which an uncorrelated (ρ = 0), periodic pair of cells becomes indistinguishable from an anticorrelated (ρ = -0.05), bursty pair of cells (inverted triangle).

